
This section describes some additional user inputs that can give you even more control over how the planner simulates your retirement. Configuring these values is optional and you don’t need to enter anything in this page unless you want to capture additional details about your plan that weren’t entered on the main input form.
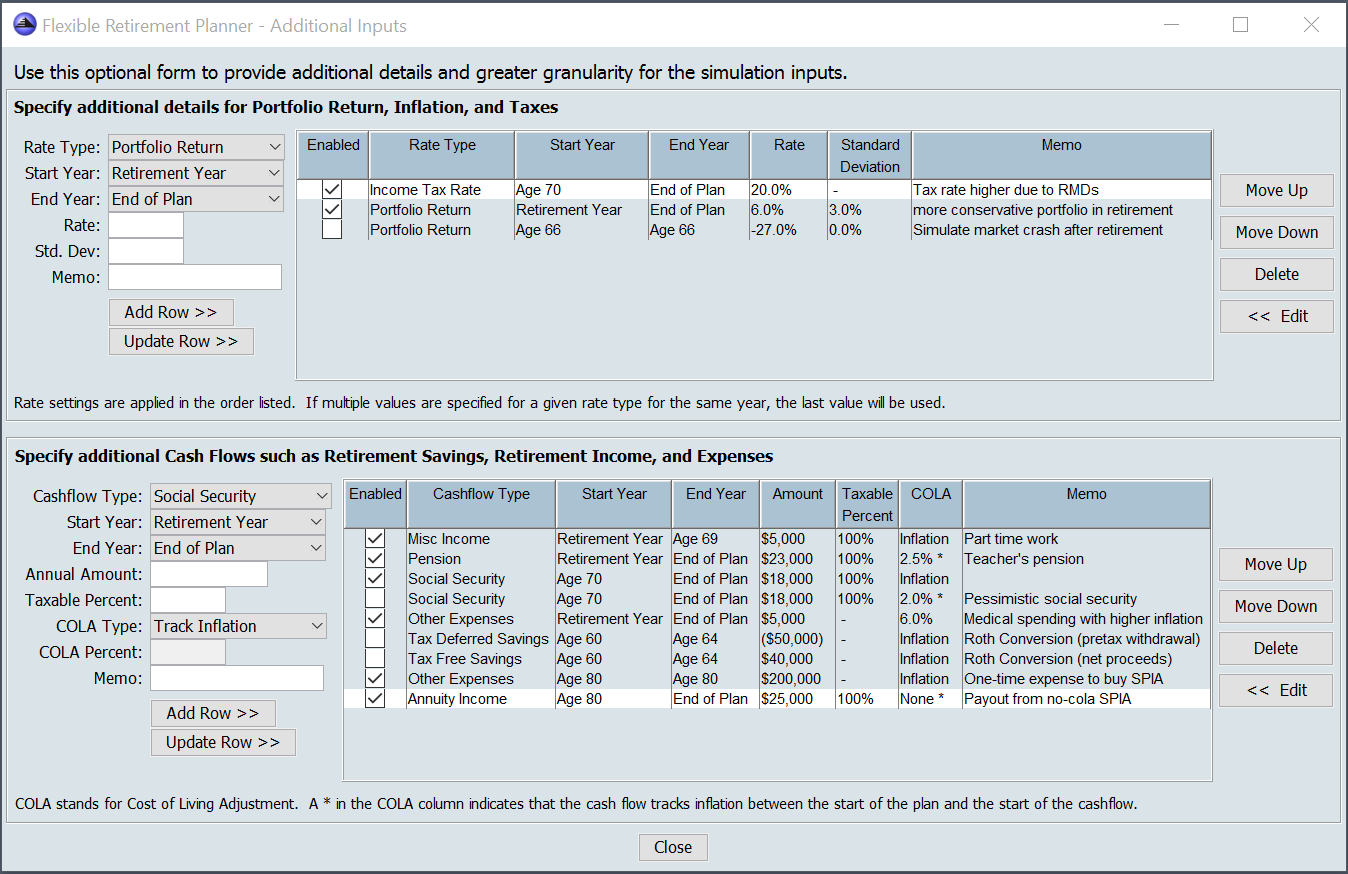
There are two tables on this page. The first table allows you to enter additional information about the portfolio return, inflation, and tax rates that you expect over the life of your plan. The second table allows you to provide more details about the cash flows (savings, income and expenses) that you expect over the course of your plan.
Each entry in the two tables can be temporarily disabled by clicking on the check box under the column labeled ‘Enabled.’ Any entries that are not marked as enabled will be ignored during simulation runs.
Additional Inputs — Portfolio Return, Inflation and Taxes
To enter more details for portfolio return, inflation, and taxes, use the controls to the left of the rate table to specify the type of rate you’d like to enter, the start and end year that you want the rate to apply, the value for the rate, and depending on the rate type, a standard deviation. Once you’ve configured the options for the new entry, click the add button to add it to the rate table.
The entries in the Rate Table are applied after any values entered on the main input page when the simulation is run. Further, the entries in this table are applied in the order they are listed. This allows you to enter multiple specifications for a given rate type to cover different years. For example, suppose that you selected 10% for portfolio return and 15% for standard deviation on the main planner input page. By default, this setting applies for the entire plan. However, you can create an additional specification for portfolio return on the additional inputs page that applies from the first year of retirement to the end of the plan. This will result in two different rates of return being applied over the life of your plan. The default rate will be applied in the early years of the plan, while the new rate will be applied in the later years. Finally, as shown in the screenshot above, you can also create a one-year setting for portfolio return to simulate a market crash. By toggling the enabled check box for this entry, you can explore how adding this simulated market crash impacts your plan.
You can (and should) verify that the simulation did what you expected by examining the year by year data on the “Detailed Output” tab after you run the simulation. This tab allows you to see what data was used in each year for inputs, as well as what outputs were generated for each year. When using additional inputs rate entries, it’s especially important to be careful with ordering. Keep in mind that entries are applied in the order listed in the table. If multiple entries for the same rate type have any overlap in years, the last entry encountered will be used for each overlap year.
Additional Inputs — Savings, Retirement Income, and Expenses
The table on the bottom of the additional inputs window lets you enter cash you plan’s expected cash flows with greater detail than the inputs on the main planner window. You can use this table in conjunction with the cash flow inputs on the main window, or you can zero out the cash flow inputs on the main window (for Savings, Income, and Expenses) and specify all of your plan’s cash flows in this table.
Create cash flow entries using the controls to the left of the table to specify the type of cash flow, the range of years that the cash flow will occur, and the annual amount of the cash flow. You can also specify how cost of living adjustments (COLA) should be applied to the cash flow. Finally, for income cash flows, you can specify the percent of the cash flow that’s subject to income taxes. Once you’ve entered all the details for the new entry, click the add button to add it to the table.
The planner offers five ways to handle cash flow Cost of Living Adjustments (COLAs):
- COLA Type Track Inflation
- Cash flow will exactly keep up with inflation
- This COLA type is often appropriate for savings, income, and expense items that automatically adjust for inflation each year. Typical uses are cash flows like savings, retirement spending, college expenses, social security, and inflation indexed annuities. For many users, this is the only cash flow type that’s needed.
- COLA Type No COLA
- Cash flow will be impacted (reduced) by inflation starting in the first year of the plan
- This COLA type is often appropriate for income or expenses where the dollar amount is fixed and not impacted by inflation. A typical use for this is a fixed mortgage payment or a pension or non-inflation indexed annuity where the payments have already begun.
- COLA Type Fixed COLA
- Cash flow is adjusted by a fixed percent each year starting in the first year of the plan.
- This COLA type is often appropriate for cash flows that have already started that will be adjusted by a fixed amount each year, regardless of inflation. One example of this is a pension payment that includes a 2% annual increase. Another example is a cash flow for future medical expenses if you expect the inflation rate for medical care to be higher than the general inflation rate.
- COLA Type Track then No COLA
- Cash flow is adjusted for inflation in the years before it starts, but once it starts it begins to lose purchasing power (is reduced) due to inflation.
- This COLA type is appropriate for cash flows that start in future with a fixed initial purchasing power, but are impacted by inflation after they begin. An example of this is a pension that starts in the future with guaranteed purchasing power of $20,000 (in today’s dollars) that doesn’t adjust for inflation after the payments start.
- COLA Type Track then Fixed
- Cash flow is adjusted for inflation in the years before it starts, then is adjusted by a fixed percentage each year after it starts.
- This COLA type is appropriate for cash flows that start in the future with a fixed initial purchasing power, and then are adjusted by a by a fixed percent each year regardless of the inflation rate. An example of this is a pension that starts in the future with a guaranteed purchasing power of $20,000 (in today’s dollars) that is increased by a fixed percent each year once the payments start.
Entries with the last two types of COLA handling (Track then No COLA, Track then Fixed) appear in the cash flow table with an asterisk after the COLA information.
You can use the flexibility of the cash flow COLA controls to track some expense separately using unique inflation rates. Notice in the screenshot above that medical expenses have been separately entered with a 6% COLA. This creates a custom 6% rate of inflation for medical expenses that’s separate from the inflation rate used in the rest of the plan. You can also use the Fixed COLA feature to be more conservative with income cash flows by increasing them at a rate lower than your plan’s inflation rate. For example, if you’d like to use a pessimistic assumption for social security payments keeping up with inflation, you could use a ” Track then Fixed” COLA Type for social security with a COLA that’s lower than the inflation rate you use for the rest of your plan.
The ‘ROTH Conversion’ cashflow type causes the amount specified to be withdrawn from the tax deferred portfolio and added to the tax free portfolio. Taxes on the conversion are calculated using the income tax rate and are added to the expenses needed for each year a ROTH conversion is done. If in any year, the tax deferred balance is less than the amount of the ROTH conversion, tax deferred funds are withdrawn until the tax deferred balance reaches zero.
As always, be sure to verify that your cash flow entries behave the way you expect by reviewing the detailed view year-by-year output table after you run the planner. All amounts in the detailed view table are shown in today’s value dollars, so cash flows that exactly keep up with inflation stay steady from year-to-year in this table. Cash flows that lose purchasing power to inflation will decrease from year-to-year in this table, while cash flows that increase at a rate higher than inflation will increase from year-to-year. A good way to explore this is to create a single income or expense cash flow and disable all the other cash flows of this type so you can see exactly how the cash flow is treated over time. (Tip, right-mouse on any column header in the detailed view table for more columns and right-mouse on any table cell for export options)
Also note that entries in the cash flow table above are applied in addition to any amounts specified on the main input page. If you want to only use cash flows that you add to the table above, be sure to go back to the main page and zero out the cash flows for savings, expenses, and retirement income.