Page 1 of 1
Feature Request: Graph of Income
Posted: Fri Jun 28, 2019 7:57 am
by clobber
Really great tool!
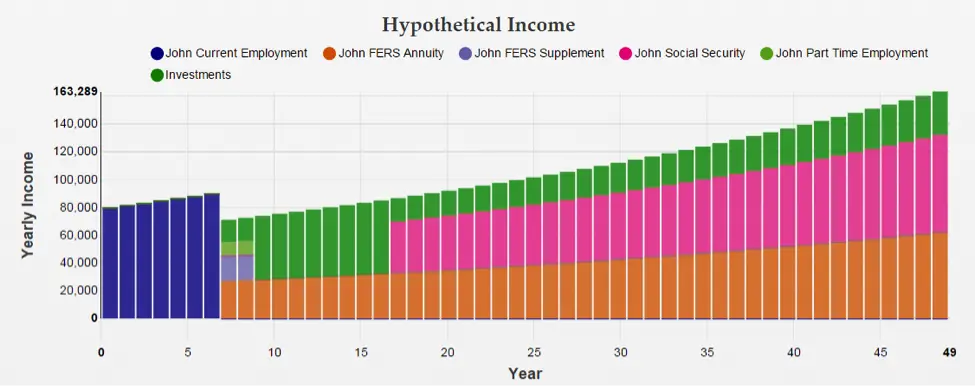
The main graph of the program is portfolio value over time. I think it would also be helpful to visualize income.
I was wondering if you could add a graph of income? Another tab maybe? Pretty much just like the one in this link:
https://www.fedsmith.com/wp-content/upl ... rity70.png The article with more description is here:
https://www.fedsmith.com/2015/01/20/con ... come-plan/.
Re: Feature Request: Graph of Income
Posted: Fri Jun 28, 2019 9:31 am
by jimr
This is an great idea that no one has suggested before.
I'd be a decent chunk of work to develop it, but I think it could be very worthwhile since there's currently no good way to visualize all the stuff entered in additional inputs.
I'd probably use the memo for the label for the graph bars and if that's blank I'd use the cashflow name.
Also, if I did this, I'd probably add two tabs, one for an income graph and one for an expenses graph.
Anyhow, thanks for the suggestion.
Jim
Re: Feature Request: Graph of Income
Posted: Fri Jun 28, 2019 5:33 pm
by clobber
Great, thanks for considering.
I didn't think it would be too much to develop since the portfolio value graph is so similar (stackable colors). But obviously you know better! Sounds reasonable to use the memo field for the label or fall back to cashflow name. That provides more possibilities for customization.
I've also been trying to figure out if an overlay of the two (income and expenses) might provide some sort of gap analysis? Not sure what that even looks like.
Re: Feature Request: Graph of Income
Posted: Sat Sep 14, 2019 8:41 pm
by clobber
Curious if you think this will be added anytime in the near future?